
When we started Toqi, our priority was to get a product that people would love to use, getting feedback and iterating as fast as possible. For the first months, we did almost nothing about what it cost to run. The user base was relatively small, so the team focused its energy on shipping fast.
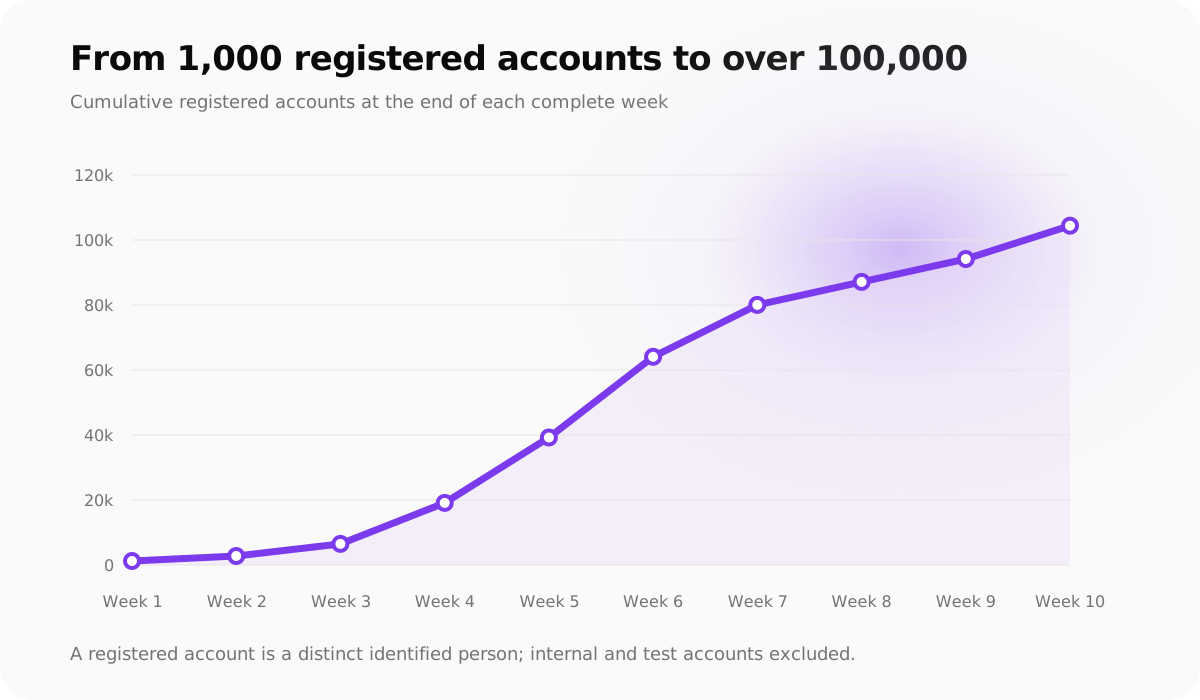
Then users arrived. Over the summer, we went from celebrating our first 1000 registered users in June to hitting more than 100,000 in August, a 100x growth in just a few weeks. Our bill followed: all the inefficiencies we had accumulated were multiplied across more and more users. With such a growth, something needed to be done fast.
We could not stop building the product to fix this properly. During the same period, Toqi was expanding and we could not afford to stop shipping, so we took deliberate actions to make the system cheaper while we continued developing it. This post illustrates the lessons we learned by doing that.
What this is not about: the most obvious win for decreasing the total bill is reducing any unnecessary LLM calls and automations for users who did not need them, but this is not the interesting part. The interesting lessons we got were in optimizing the cost per task (which for simplicity we consider as cost per AI response).
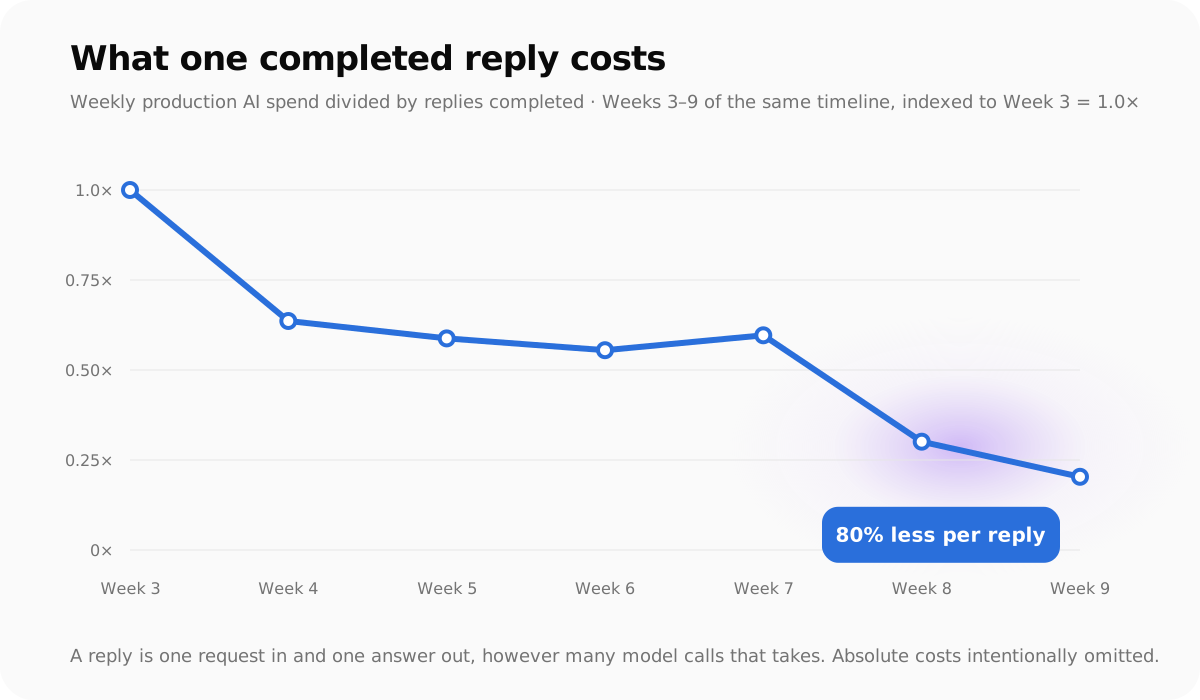
Cost per task is a combination of: cost per token, number of tokens sent and generated per turn, number of turns the agent needs to complete the task. All of these can be tuned. Over the last weeks, we managed to drop this cost by 80%, and the weekly bill ended roughly where it started, even though we had many more daily active users at the time.
Here are the four lessons that did most of the work.
1. The model is not the only problem
After building our evals set based on real use cases, we ran it across several models. Results differed a lot for different model families, and such a change can be quite painful when you already have a product in front of users. At that stage, we realized that the biggest win was somewhere else: measuring what we were actually sending the model, rather than the model that received it.
Toqi is not just a chatbot, it has access to many tools and skills to do things for people, so beyond the user messages, our requests were carrying a lot of extra information: detailed system instructions, a description of every tool available, the conversation so far, the results of earlier tool calls, which were sent to the LLM several times during a task.
In particular, we noticed that descriptions of tools and skills were the vast majority of the fixed part in every request, not the prompt we had spent weeks polishing.
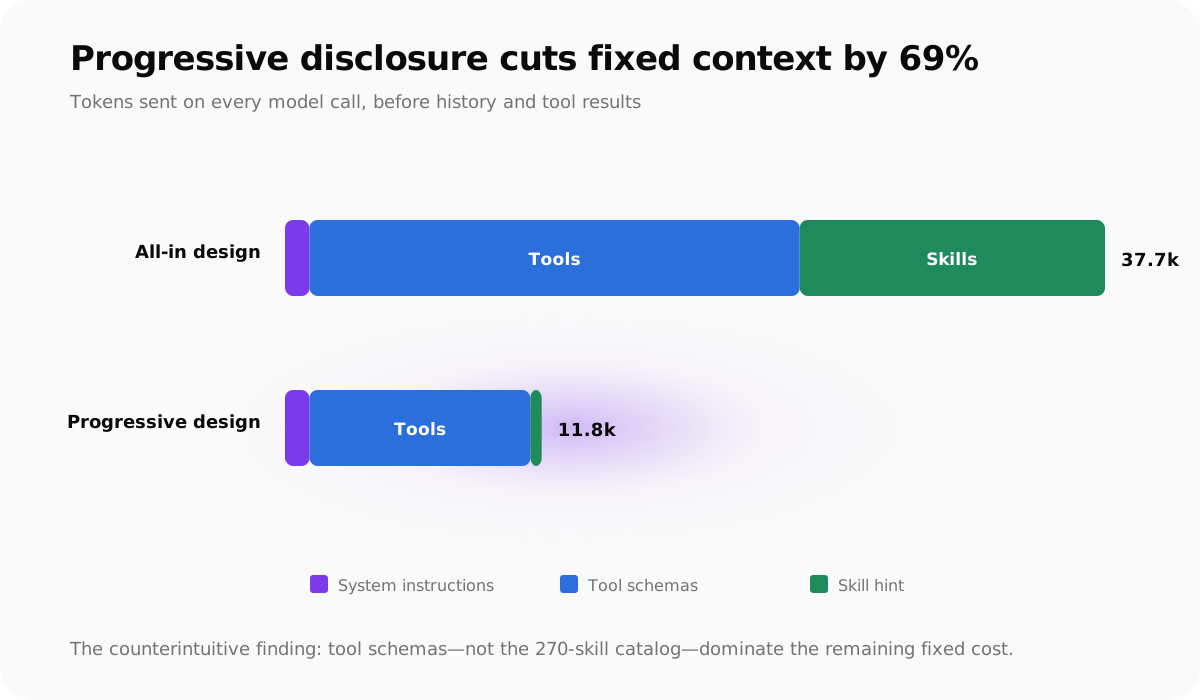
The good news is that even if Toqi knows how to do hundreds of things, it does not hear about all of them up front. The pattern is progressive disclosure: instead of putting the whole catalog into every request, the agent sees a compact map of what it could do, and the details are loaded only when they are needed.
Concretely, we split capabilities in two. A small set of core tools is always on, because almost every task uses them. Everything else lives in skills, which are bundles of instructions together with the tools they need. On every turn we rank the skill descriptions against the recent conversation using a small embedding model, and the agent sees only the top ones, one short line each. When Toqi decides a skill is useful, it opens it, and only then do the full instructions and that skill's tools enter the request.
2. Caching breaks silently
Model providers charge less for the part of a request they have seen before. Caching is no longer an optimization, it's a huge lever on inference cost for input-heavy agents, and every major provider has now priced it that way.
In general, for this to work, the cached part has to be identical, character for character. Move a timestamp, reorder your tool list, change how a value gets serialized, and the discount quietly stops applying. Exactly how strict this is depends on the provider, and it can change between model versions.
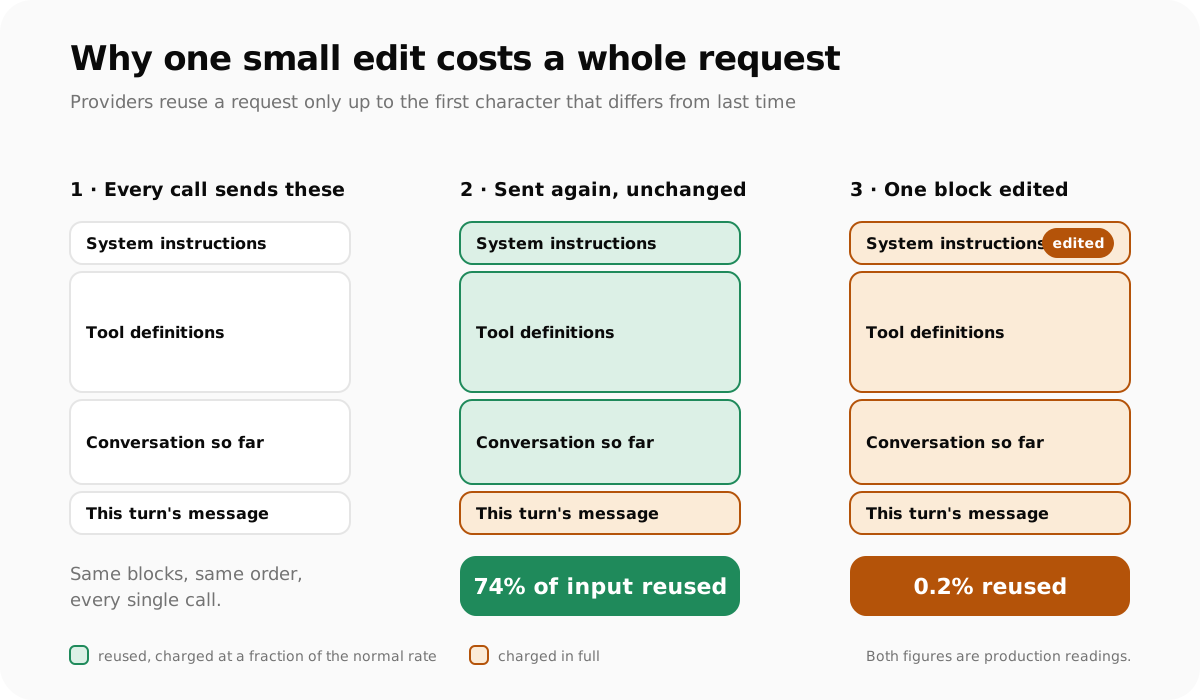
We know this because we got it wrong. When we moved some of our calls to the GPT-5.6 family, our caching rate went down and we did not notice it immediately. Nothing was broken, the answers were still good and the assistant still worked, but the bill did not decrease as expected, even though the model was cheaper. The reason was that the new model decides differently where the reusable part of a request ends, so something that cached well before stopped caching.
Now, we make sure caching is explicit. This raised the hit rate and reduced estimated API cost per call down to a fifth compared to no caching. We also watch the share of each request that gets reused and we monitor cache hit rate as a first-class metric (our rule of thumb is to keep it above 70%), so we find out when a new field in the prompt breaks the prefix.
In practice, this means deciding what goes before the cache boundary and what goes after. We split every request in two parts. The first part is stable: the shared system instructions and the core tool definitions. Everything that changes comes after it: ranked skills, new messages, tool results. This is also one of the reasons why we decided to keep our core tools always on and limit dynamic tool loading for specific capabilities. For us, a slightly larger tool set that stays the same ended up being cheaper than a minimal one that was different every time. And when a skill gives access to new tools, we add them after the base ones instead of inserting them in the middle, so the cached part stays intact.
3. Sending less sometimes costs more
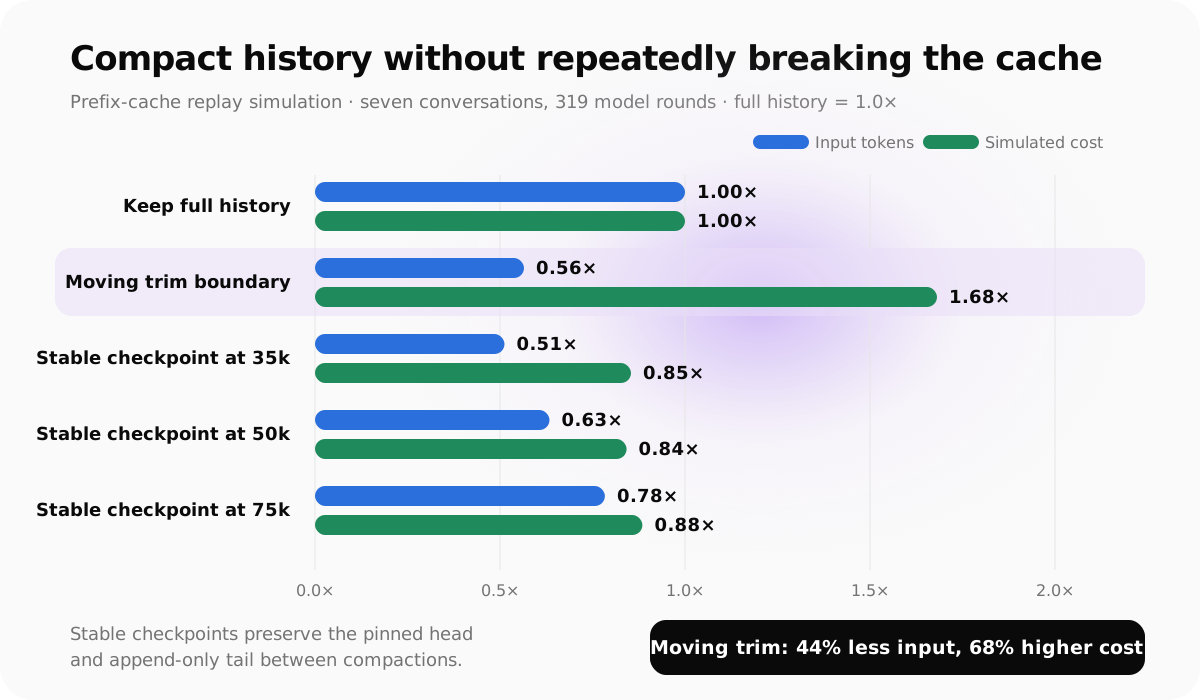
The same trap caught us again when we tried to shorten long conversations. Tool results can be quite long (e.g. search results, website contents), so the first thing we tested was deleting the oldest ones once the model had used them.
When checking this over real conversations, it sent 44% fewer tokens, which is great, but it ended up costing 68% more.
The reason why this happened is that the "oldest" cached part of the conversation kept moving: something different was deleted on every step, so the middle of the request changed every time. In practice, everything after the change had to be read fresh at full price. As we have seen above, preserving cache locality can matter more than minimizing raw token count.
What worked for us instead is summarizing once, at a fixed point, and then leaving that summary alone. In the same replay, that sent 37% fewer tokens than keeping the full history and cost 16% less, which is half the cost of trimming aggressively. A request is expensive because of how much of it is new, not just because of how long it is.
4. Cheaper models are not always the answer, even if quality holds
The other obvious way to spend less is to run a cheaper model, which we were already running on one of Toqi's slower background jobs.
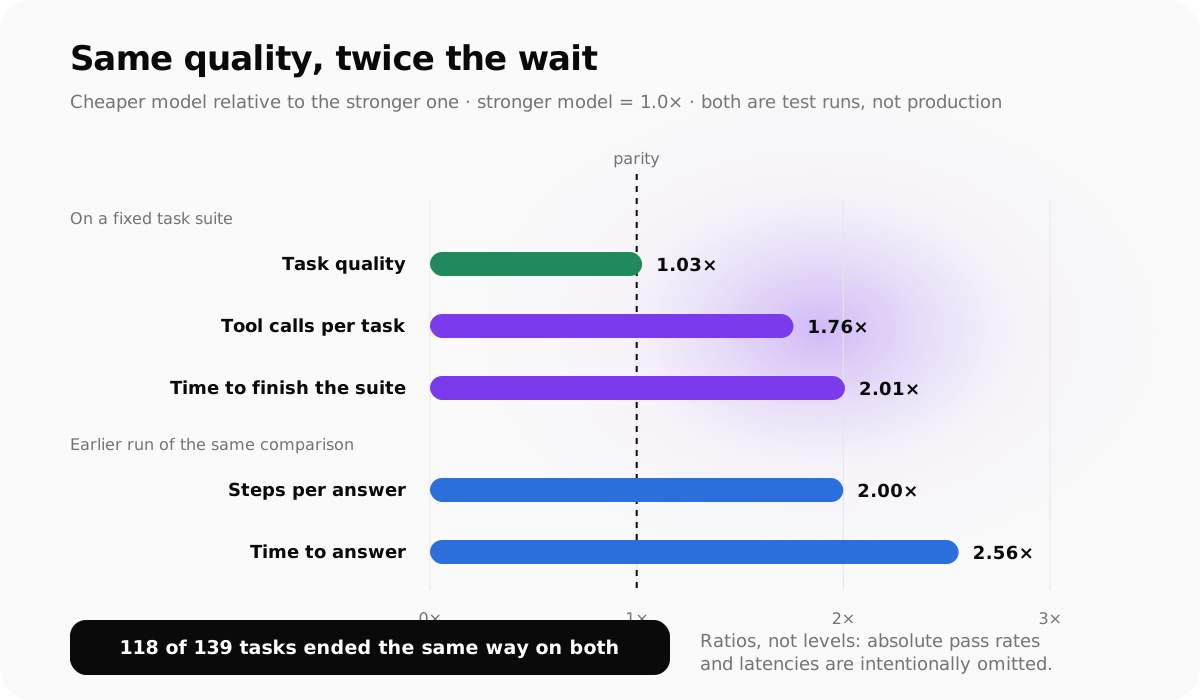
When testing the cheaper model against the current one on our evals suite, the success rate was very similar and for some tasks even better. Considering quality and price per token, it was clearly the better option. The model was also faster for the same number of tokens processed.
However, when looking at how it answered, we realized that the cheaper model made 76% more tool calls per task and took twice as long compared to the baseline. Every step was cheaper and faster but there were simply far more of them, and the person waiting would feel all of them.
So now we split by whether someone is waiting. Realtime answers get the model that keeps latency low, and background or asynchronous jobs can take the cheaper one, where a few extra steps cost nothing.
Putting it all together
These are just some of the changes that we did. As they happened while actively building the product, it was fundamental to ship them without disrupting the experience. Every time we tested something, we evaluated it locally against a realistic evals set, then rolled it out progressively behind a feature flag, monitoring quality drift and regressions.
Looking back, we did not have any of this in place on day 1, and building it on day 1 would probably have been the wrong call. Most of these bottlenecks simply did not exist with a small user base, and the ones we would have planned for in June were not the ones we got in August. What we needed was not to predict them, but to find them quickly and fix them.
Three things made that possible:
Planning for change instead of for scale: assume everything might change. Things like feature flags on model and infrastructure paths, and a rollback that actually works, are what allow us to iterate fast and create a robust architecture. These are cheap to add early and painful to retrofit.
Instrumenting the right signals so we could act on them: cost per task, cache hit rate, tokens and rounds per call. These are hard to backfill. With them in place, we could leave cost alone until it became a real problem, and then fix it in days.
Prioritizing from measurement and not from intuition: our assumptions about where the tokens were going were wrong more than once. Tokenizing actual requests took an afternoon and changed what we worked on next.
The weekly bill ended roughly where it started, with far more people using Toqi and the cost per task 80% lower. We did not get there by planning for it. We got there by being able to see each bottleneck when it arrived, and to fix it without stopping the product.